Momentum
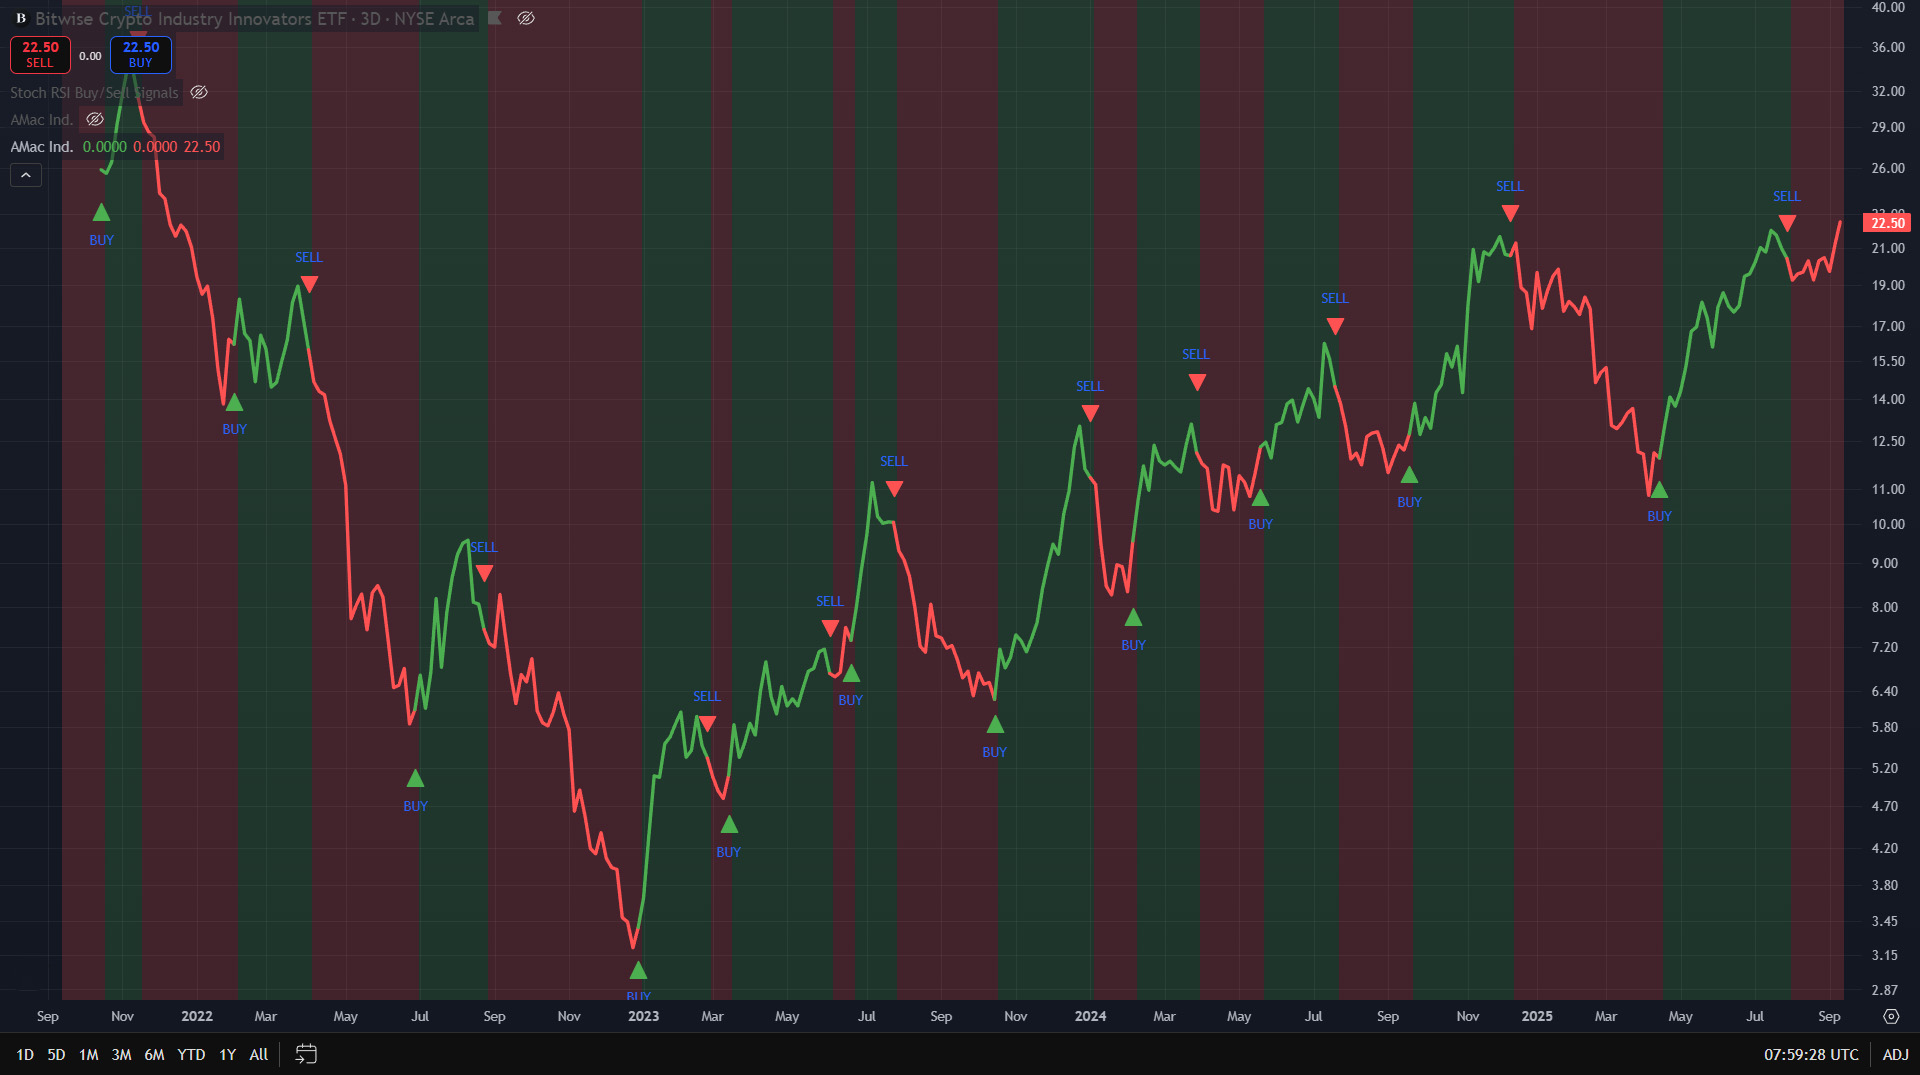
AMac Buy/Sell Indicator
Tracks momentum directional change and confirms trend direction continuation after a minimal delta. Designed to catch major swing pivots with minimal whipsaw.
Get access to AMac buy/sell signals, trading indicators, BTC risk metric/log regression, and more designed to help multiple strategies for better trading entries/exits, swing trading, and long term investing.
Each section demonstrates the indicators with a chart and brief explanation of what the indicator is and what it does.
Tracks momentum directional change and confirms trend direction continuation after a minimal delta. Designed to catch major swing pivots with minimal whipsaw.
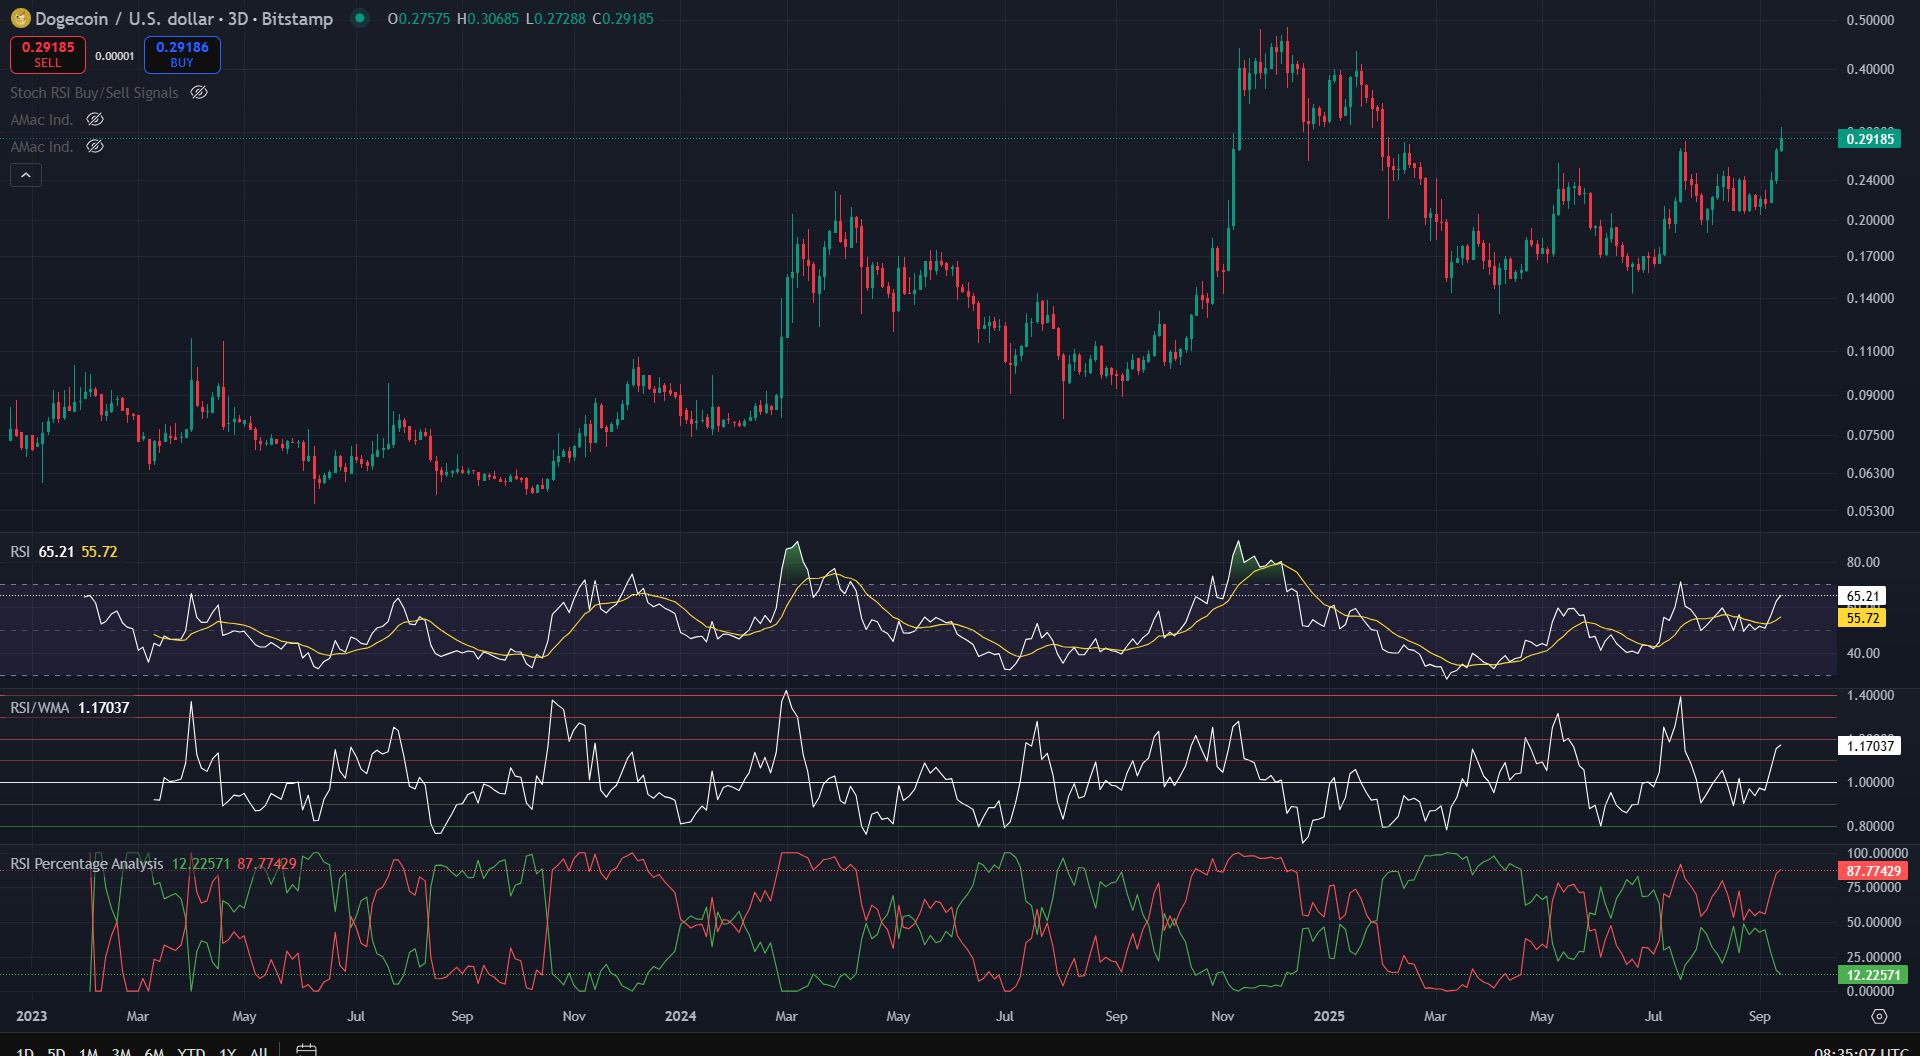
RSI percentage analysis and RSI/WMA indicators, they help tremendously for timing extremes (ie RSI % more than 99%)
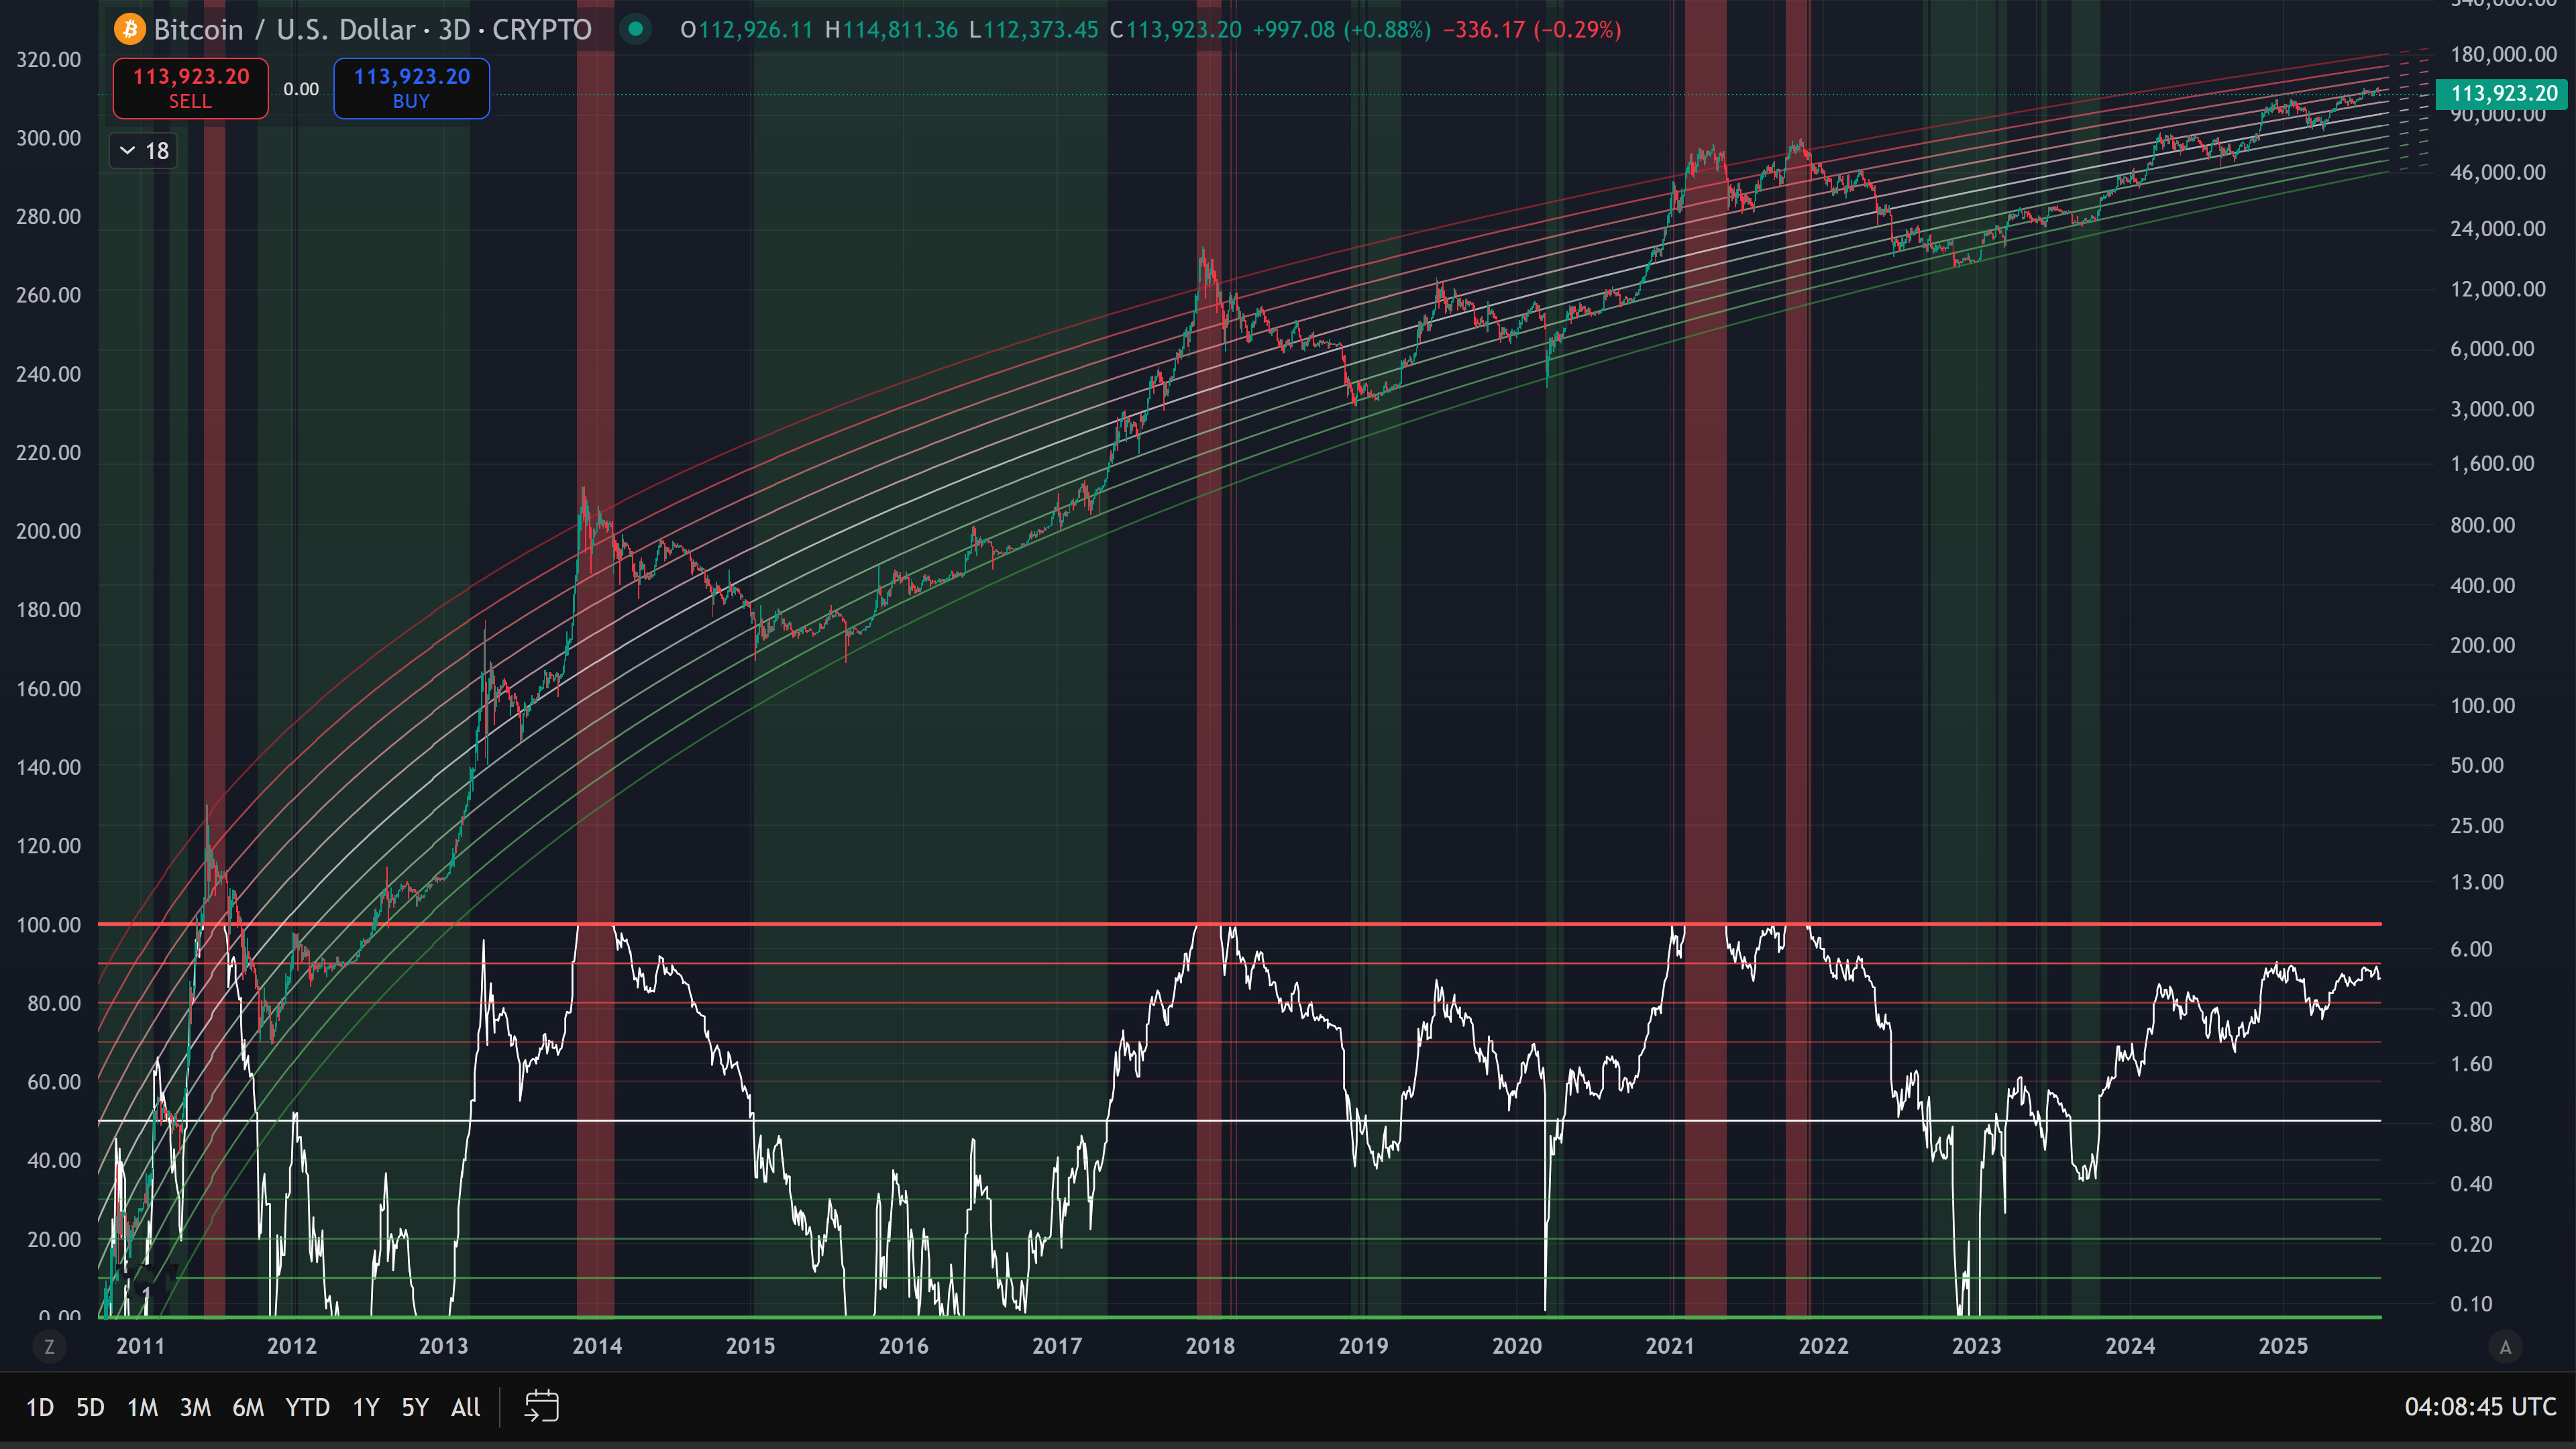
The BTC Risk Metric helps show BTC's cyclical ebb and flow and whether were closer to a top or bottom. It helps tremendously for accumulating at BTC cyclical bottoms and distributing at BTC tops.Normalizes peak risk to 100 with calibrated upper bounds just above historical tops. Provides clean, comparable risk zones across cycles.
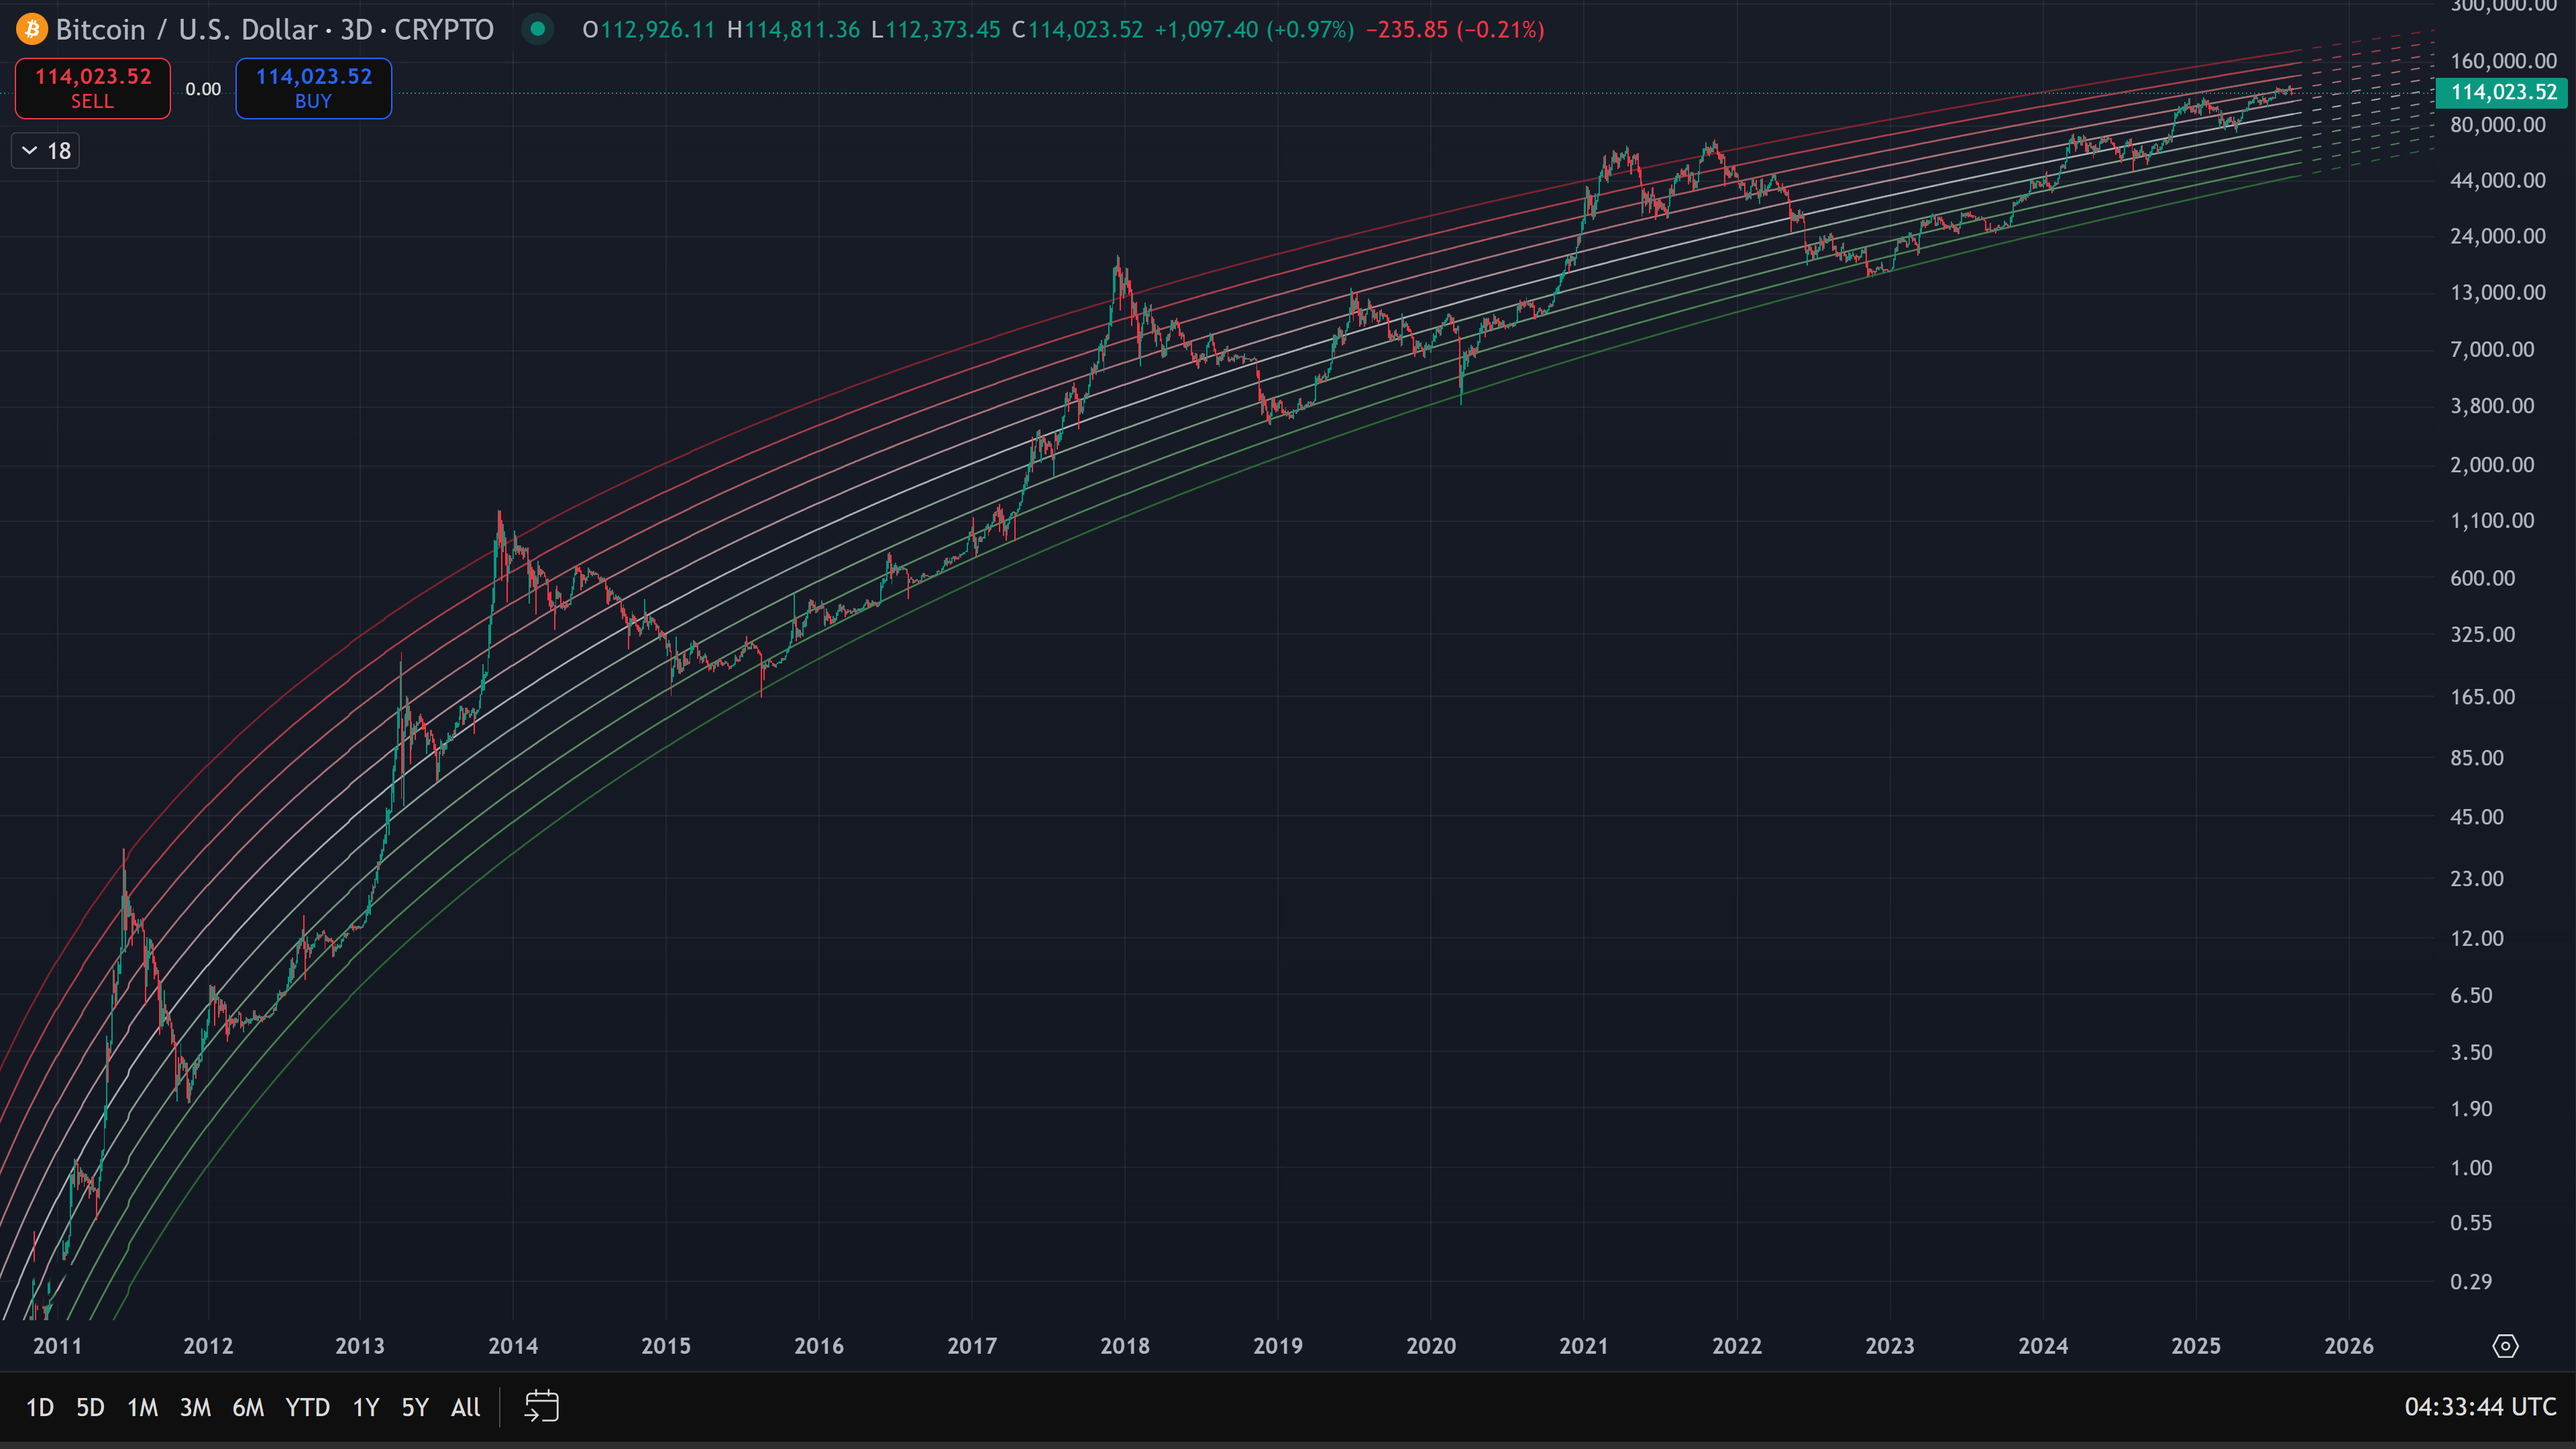
BTC logarithmic regression (power law) bands showing a realistic price range over time that helps show when BTC is over extended or over sold.
Built for speed and signal. I focus on confluence—momentum turns, structural trend, macro bounds, and a clean confidence score—so every trade has logic you can explain in one sentence.
Questions, collabs, or access? Drop a note: